How to Read Dogecoin Price Charts for Smarter Trading

Dogecoin may have started as a meme, but if you’re trading it seriously in 2025, you’ll need more than a sense of humor. Successful trading requires understanding price charts, spotting patterns, and applying basic technical analysis. Whether you’re new to crypto or just looking to sharpen your skills, learning how to read Dogecoin price charts can help you make more informed—and potentially more profitable—decisions. So, let’s dive in and decode what those candles, lines, and indicators really mean.
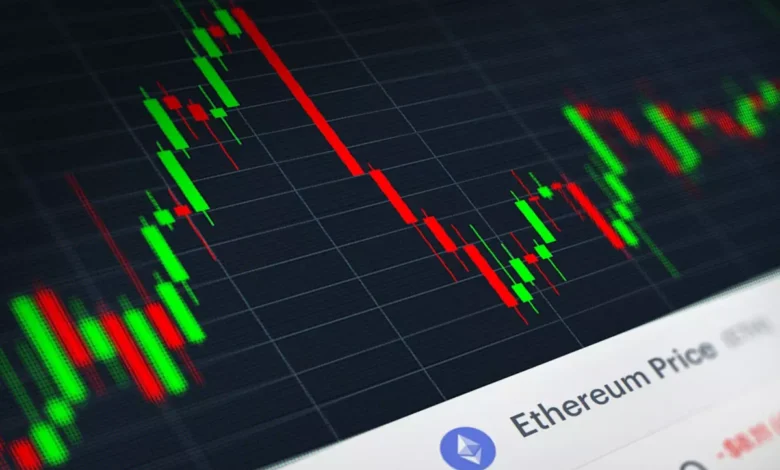
At the heart of any Dogecoin chart guide is the candlestick chart. Unlike the simple line graphs you might see on Google, candlestick charts pack a ton of information into each candle. A single candle shows four key data points: the opening price, closing price, highest price, and lowest price for a given time. If the candle is green (or white, depending on your theme), it means the price closed higher than it opened—bullish. If it’s red (or black), the price is lower bearish. By observing how these candles form and interact over time, traders can detect market sentiment and momentum shifts.
Another key aspect of reading DOGE price charts is support and resistance levels. These are price zones where Dogecoin tends to pause, bounce, or reverse. Support is a level where buyers typically step in and prevent further drops. Resistance is the opposite—where sellers emerge and cap upward movement. Drawing horizontal lines on past price peaks and dips can help you visualize these zones. When DOGE breaks above resistance, it could signal a bullish breakout. When it falls below support, a downtrend may follow.
Volume also plays a vital role in DOGE technical analysis. It tells you how much Dogecoin is being traded during a specific time. High volume on a price breakout gives the move more credibility—it suggests strong interest and conviction. On the other hand, a price move on weak volume may be short-lived or easily reversed. Volume bars are usually found at the bottom of the chart and are color-coded to match the candle direction.
If you’re learning how to trade DOGE, don’t ignore technical indicators. Tools like the Relative Strength Index (RSI) and Moving Averages are essential. The RSI helps you see whether DOGE is overbought (above 70) or oversold (below 30), indicating a potential reversal. Moving Averages smooth out price data to reveal trends. The 50-day and 200-day moving averages are particularly popular. When the short-term average crosses above the long-term one, that’s a bullish signal known as a “golden cross.” The opposite is a “death cross”—not as fun.
Chart patterns also matter. Recognizing formations like head and shoulders, triangles, and flags can help you anticipate future price moves. These patterns tend to repeat across different timeframes and assets, and they often hint at market psychology—fear, greed, consolidation, or breakout attempts.
In the end, trading Dogecoin isn’t just about catching hype. It’s about understanding the behavior of price and volume. Even with a coin as unpredictable as DOGE, the charts tell a story. Learning how to read them doesn’t guarantee success, but it stacks the odds more in your favor.
So, whether you’re chasing short-term profits or planning long-term entries, becoming fluent in Dogecoin charts will help you move beyond the memes and into real trading strategy.
For more insights on analyzing cryptocurrencies, you might find our guide on Bittorrent Coin interesting.


